[RenPy] 纯文本查看 复制代码
init python:
import math
class LineChart(renpy.Displayable):
def __init__(self,values,max_value=10,size=None,padding=None,levels=None,point_image=None,colors=None,**kwargs):
super(LineChart,self).__init__(**kwargs)
self.texts = list(values.keys())
self.nums = list(values.values())
self.max_value = max_value
self.size = size or (600,400)
self.padding = padding or (30,30,30,30)
self.levels = levels or 1
self.point_image = point_image
self.colors = colors or ["#000000","#888888","#ffaa66","#ffffff"]
self.line_size = 1 # 线的粗细
self.tick_length = 0 # 刻度线长度,小于0不渲染
self.text_size = min(self.size)*0.04 # 文本尺寸
self.text_offset = 10 # 文本扩散偏移
self.point_size = (min(self.size)*0.02,min(self.size)*0.02) # 数据点尺寸
def render(self,width,height,st,at):
render = renpy.Render(self.size[0],self.size[1])
canvas = render.canvas()
plot_width = self.size[0] - self.padding[0] - self.padding[1]
plot_height = self.size[1] - self.padding[2] - self.padding[3]
# 绘制背景
canvas.polygon(self.colors[0],[(0,0),(self.size[0],0),(self.size[0],self.size[1]),(0,self.size[1])])
# 上下X轴
canvas.line(self.colors[1],(self.padding[0],self.padding[2] + plot_height),(self.padding[0] + plot_width,self.padding[2] + plot_height),width=self.line_size)
canvas.line(self.colors[1],(self.padding[0],self.padding[2]),(self.padding[0] + plot_width,self.padding[2]),width=self.line_size)
# 左右Y轴
canvas.line(self.colors[1],(self.padding[0],self.padding[2]),(self.padding[0],self.padding[2] + plot_height),width=self.line_size)
canvas.line(self.colors[1],(self.padding[0] + plot_width,self.padding[2]),(self.padding[0] + plot_width,self.padding[2] + plot_height),width=self.line_size)
# Y轴
for i in range(self.levels + 1):
y_value = self.max_value * (i / self.levels)
y_pixel = self.padding[2] + plot_height - (i / self.levels) * plot_height
# 左右刻度线
if self.tick_length > 0:
canvas.line(self.colors[1],(self.padding[0] - self.tick_length,y_pixel),(self.padding[0],y_pixel),width=self.line_size)
canvas.line(self.colors[1],(self.padding[0] + plot_width,y_pixel),(self.padding[0] + plot_width + self.tick_length,y_pixel),width=self.line_size)
# 横向网格线
canvas.line(self.colors[1],(self.padding[0],y_pixel),(self.padding[0] + plot_width,y_pixel),width=self.line_size)
# Y轴文本
text = Text(str(int(y_value)),size=self.text_size,color=self.colors[3])
text_render = renpy.render(text,self.text_size,self.text_size,st,at)
w,h = text_render.get_size()
render.blit(text_render,(self.padding[0] - w - self.text_offset,y_pixel - h/2))
# X轴
num_points = len(self.texts)
if num_points > 1:
step_x = plot_width / (num_points - 1)
for i,text_text in enumerate(self.texts):
x_pixel = self.padding[0] + i * step_x
# 上下刻度线
if self.tick_length > 0:
canvas.line(self.colors[1],(x_pixel,self.padding[2] - self.tick_length),(x_pixel,self.padding[2]),width=self.line_size)
canvas.line(self.colors[1],(x_pixel,self.padding[2] + plot_height),(x_pixel,self.padding[2] + plot_height + self.tick_length),width=self.line_size)
# X轴文本
text = Text(text_text,size=self.text_size,color=self.colors[3])
text_render = renpy.render(text,self.text_size,self.text_size,st,at)
w,h = text_render.get_size()
render.blit(text_render,(x_pixel - w/2,self.padding[2] + plot_height + self.text_offset))
# 折线
if len(self.nums) == num_points and num_points > 1:
points = []
step_x = plot_width / (num_points - 1)
for i,value in enumerate(self.nums):
x_pixel = self.padding[0] + i * step_x
ratio = value / self.max_value
y_pixel = self.padding[2] + plot_height - ratio * plot_height
points.append((x_pixel,y_pixel))
# 绘制折线
for i in range(len(points) - 1):
canvas.line(self.colors[2],points[i],points[i+1],width=self.line_size)
# 绘制数据点
for i,(x_pixel,y_pixel) in enumerate(points):
if self.point_image:
point = Image(self.point_image)
# 获取图片原始尺寸
point_render = renpy.render(point,width,height,st,at)
img_w,img_h = point_render.get_size()
else:
point = Solid(self.colors[2],xysize=self.point_size)
point_render = renpy.render(point,self.point_size[0],self.point_size[1],st,at)
img_w,img_h = self.point_size
# 以图片中心对齐数据点
render.blit(point_render,(x_pixel - img_w/2,y_pixel - img_h/2))
# 数据点上方显示数值标签
val_text = Text(str(self.nums[i]),size=self.text_size,color=self.colors[3])
val_render = renpy.render(val_text,self.text_size,self.text_size,st,at)
w,h = val_render.get_size()
render.blit(val_render,(x_pixel - w/2,y_pixel - h - self.text_offset))
return render
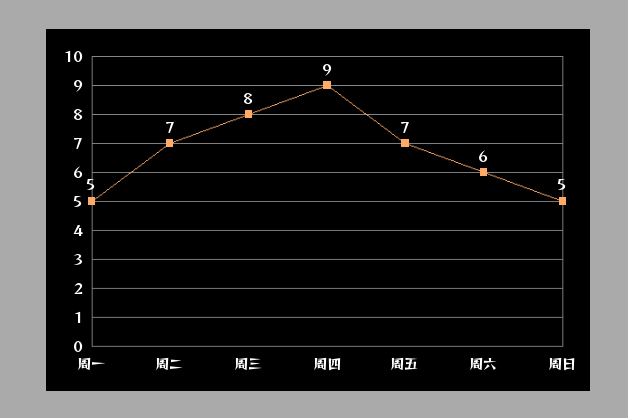
# 示例数据,只有values是必要入参,其他的有默认
image linechart = LineChart(
values={"周一": 5,"周二": 7,"周三": 8,"周四": 9,"周五": 7,"周六": 6,"周日": 5},# 数值字典,从左往后读取
max_value=10, # 图表最大数值
size=(600,400), # 整个图表的尺寸
padding=(50,30,30,50), # 图的边距(文本不纳入计算)
levels=10, # 网格层级
point_image=None, # 数据点,不入参使用自动小矩形,入参则使用入参图片
colors=["#000000","#888888","#ffaa66","#ffffff"]) # 颜色列表,背景色,网格色,折线色,文字色
label test:
show linechart:
align(0.5,0.5)

 发表于 2026-4-20 18:52:29

 提升卡
提升卡 置顶卡
置顶卡 变色卡
变色卡 千斤顶
千斤顶